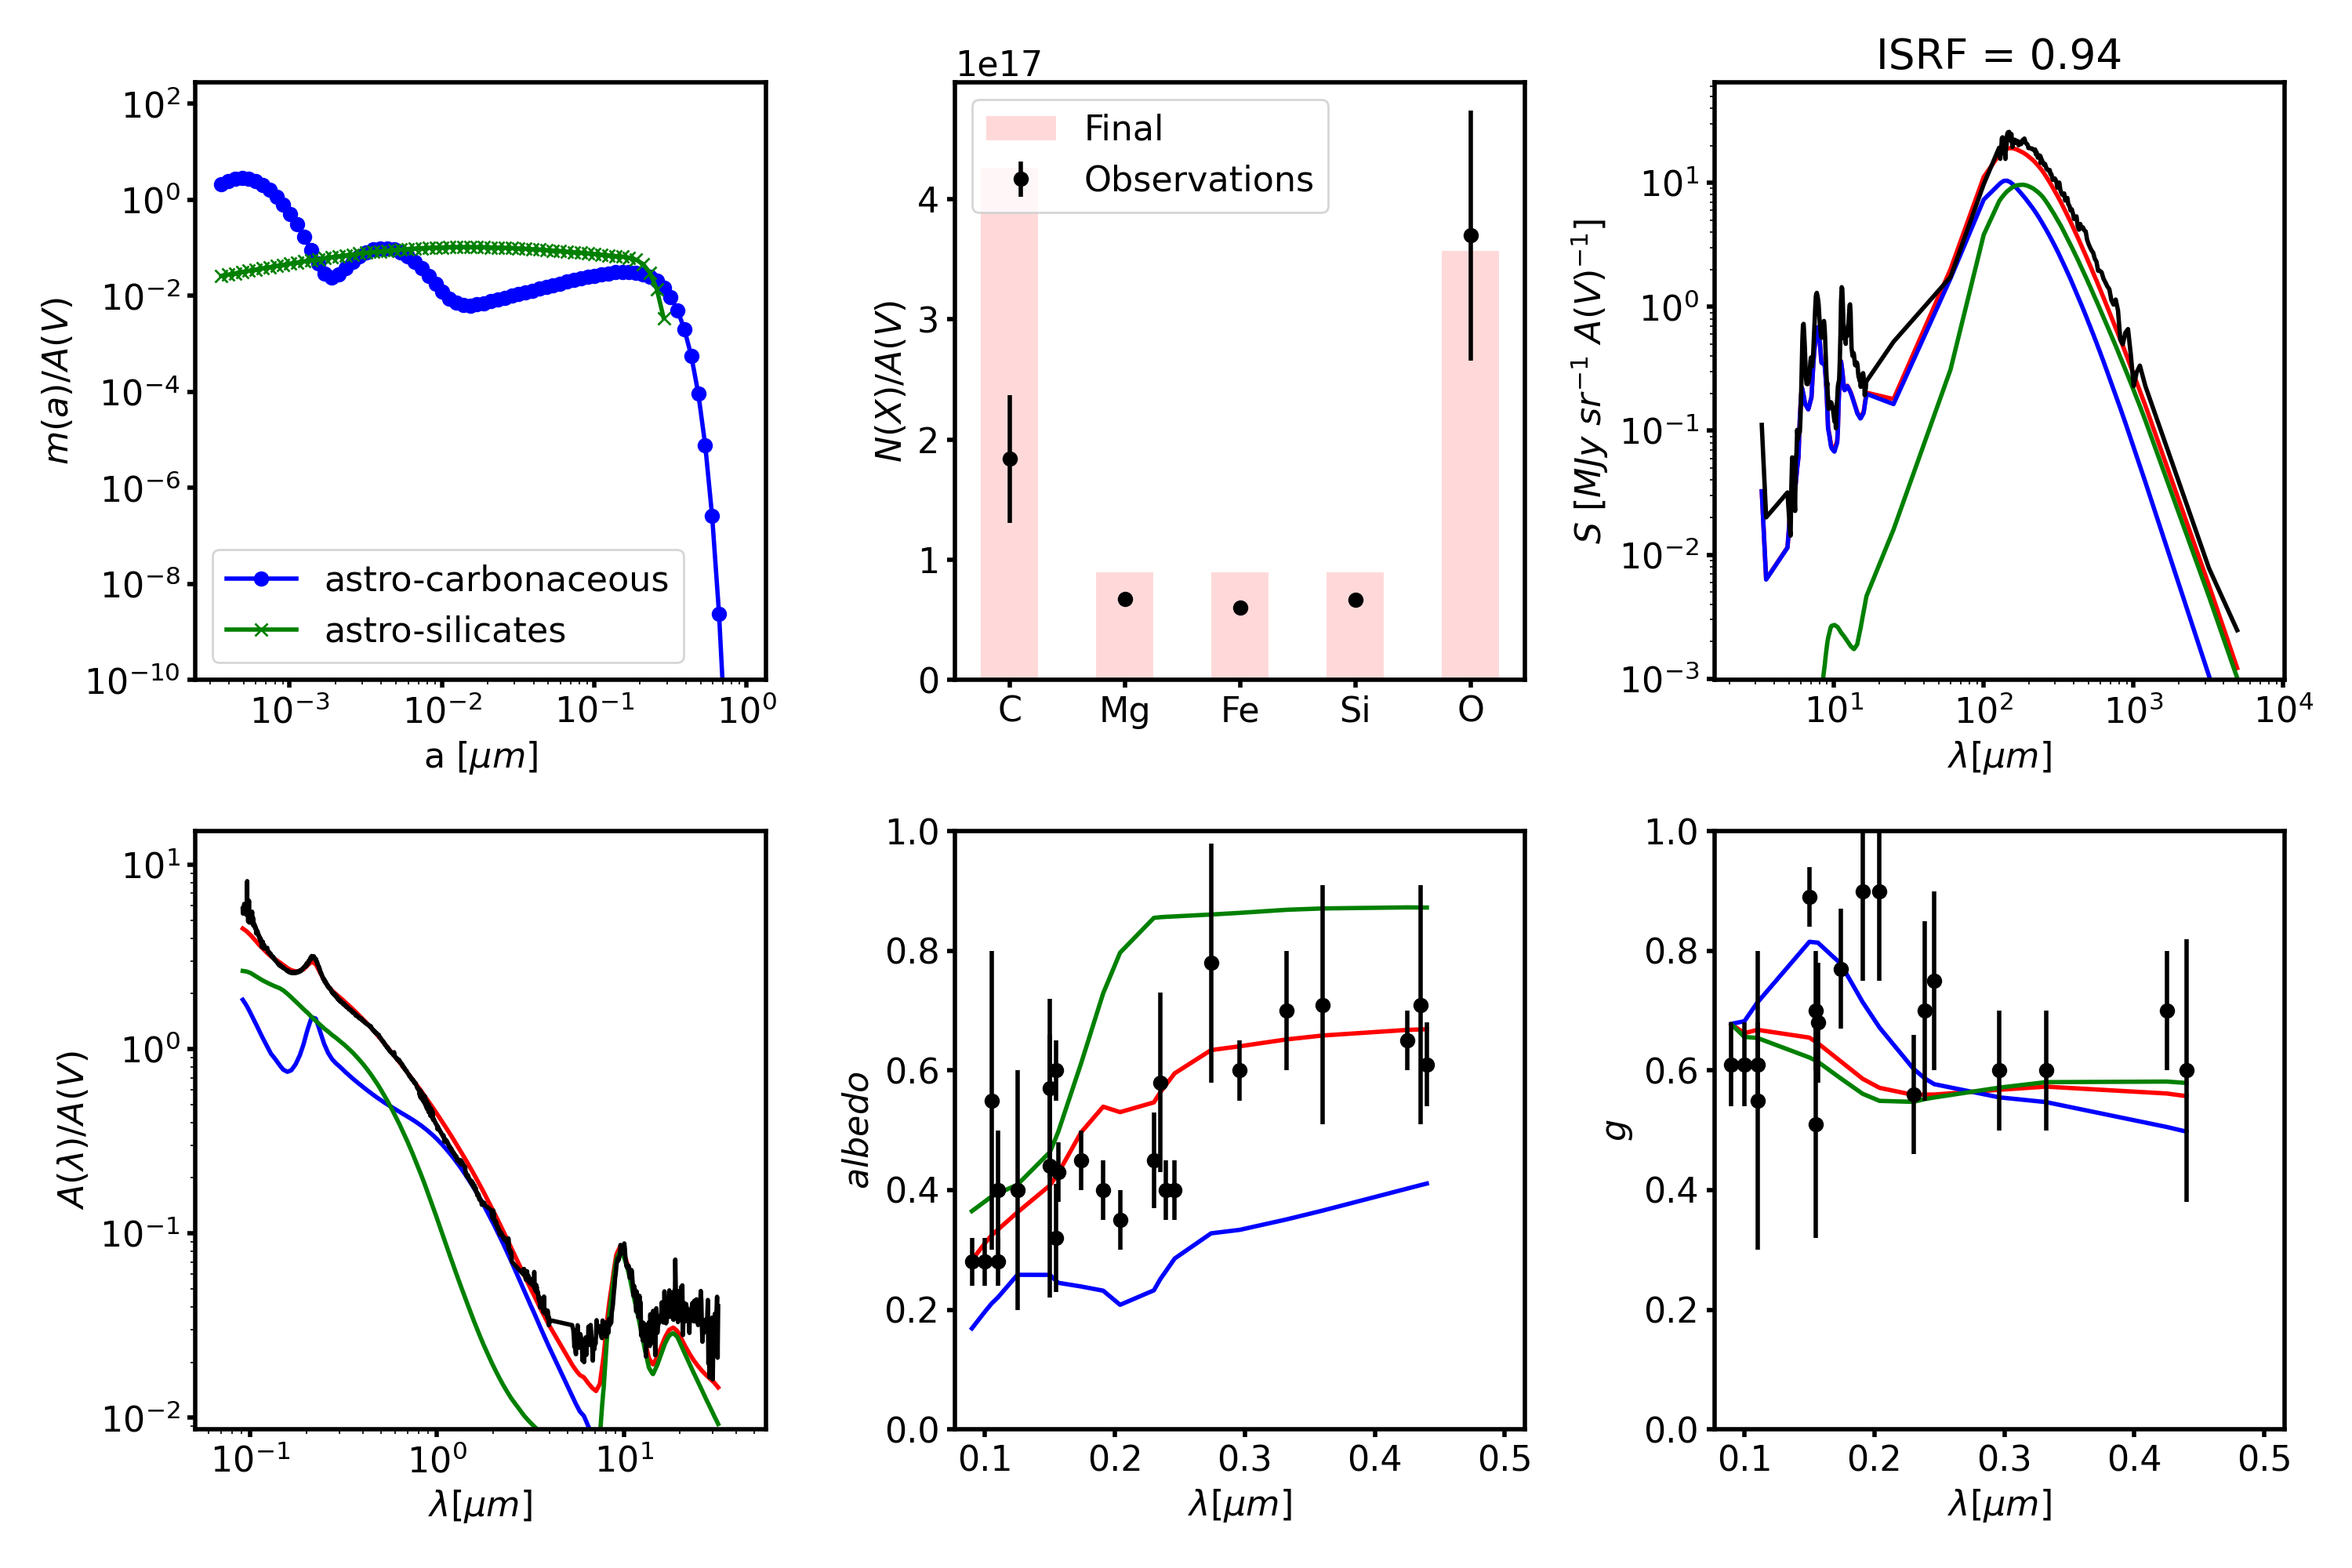
Plot Results
A number of different programs exists to plot the inputs, results of the fitting and information on the used dustgrains. The default plots are in units per A(V), converting to units per N(HI) is always possible.
Results
To plot the results in filename based on the obsdata, use the command
plot_dgfit filename obsdata
For example, to plot the default run results from the optimizer (= max prob):
plot_dgfit WD01_grains_all_points_WD_sizedist_best_optimizer.fits obsdata
(Source code, png, hires.png, pdf)
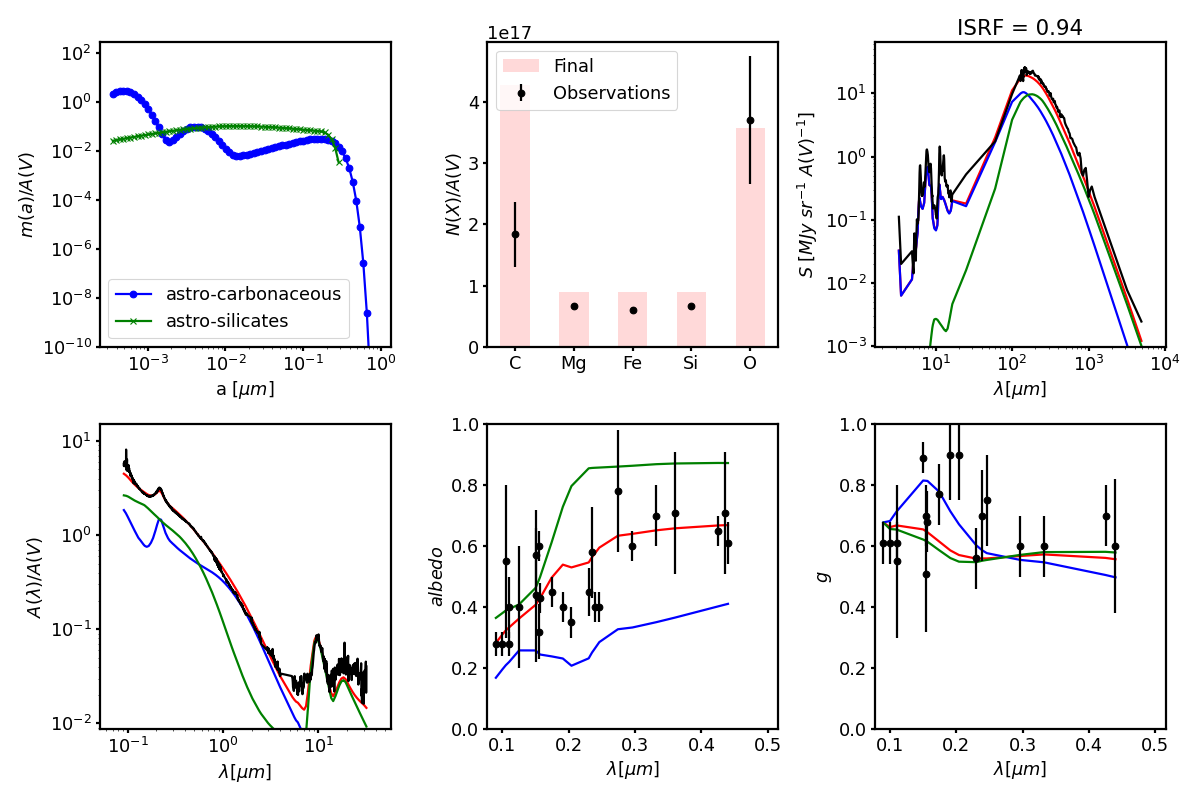
To include the starting points
plot_dgfit WD01_grains_all_points_WD_sizedist_best_optimizer.fits obsdata --start
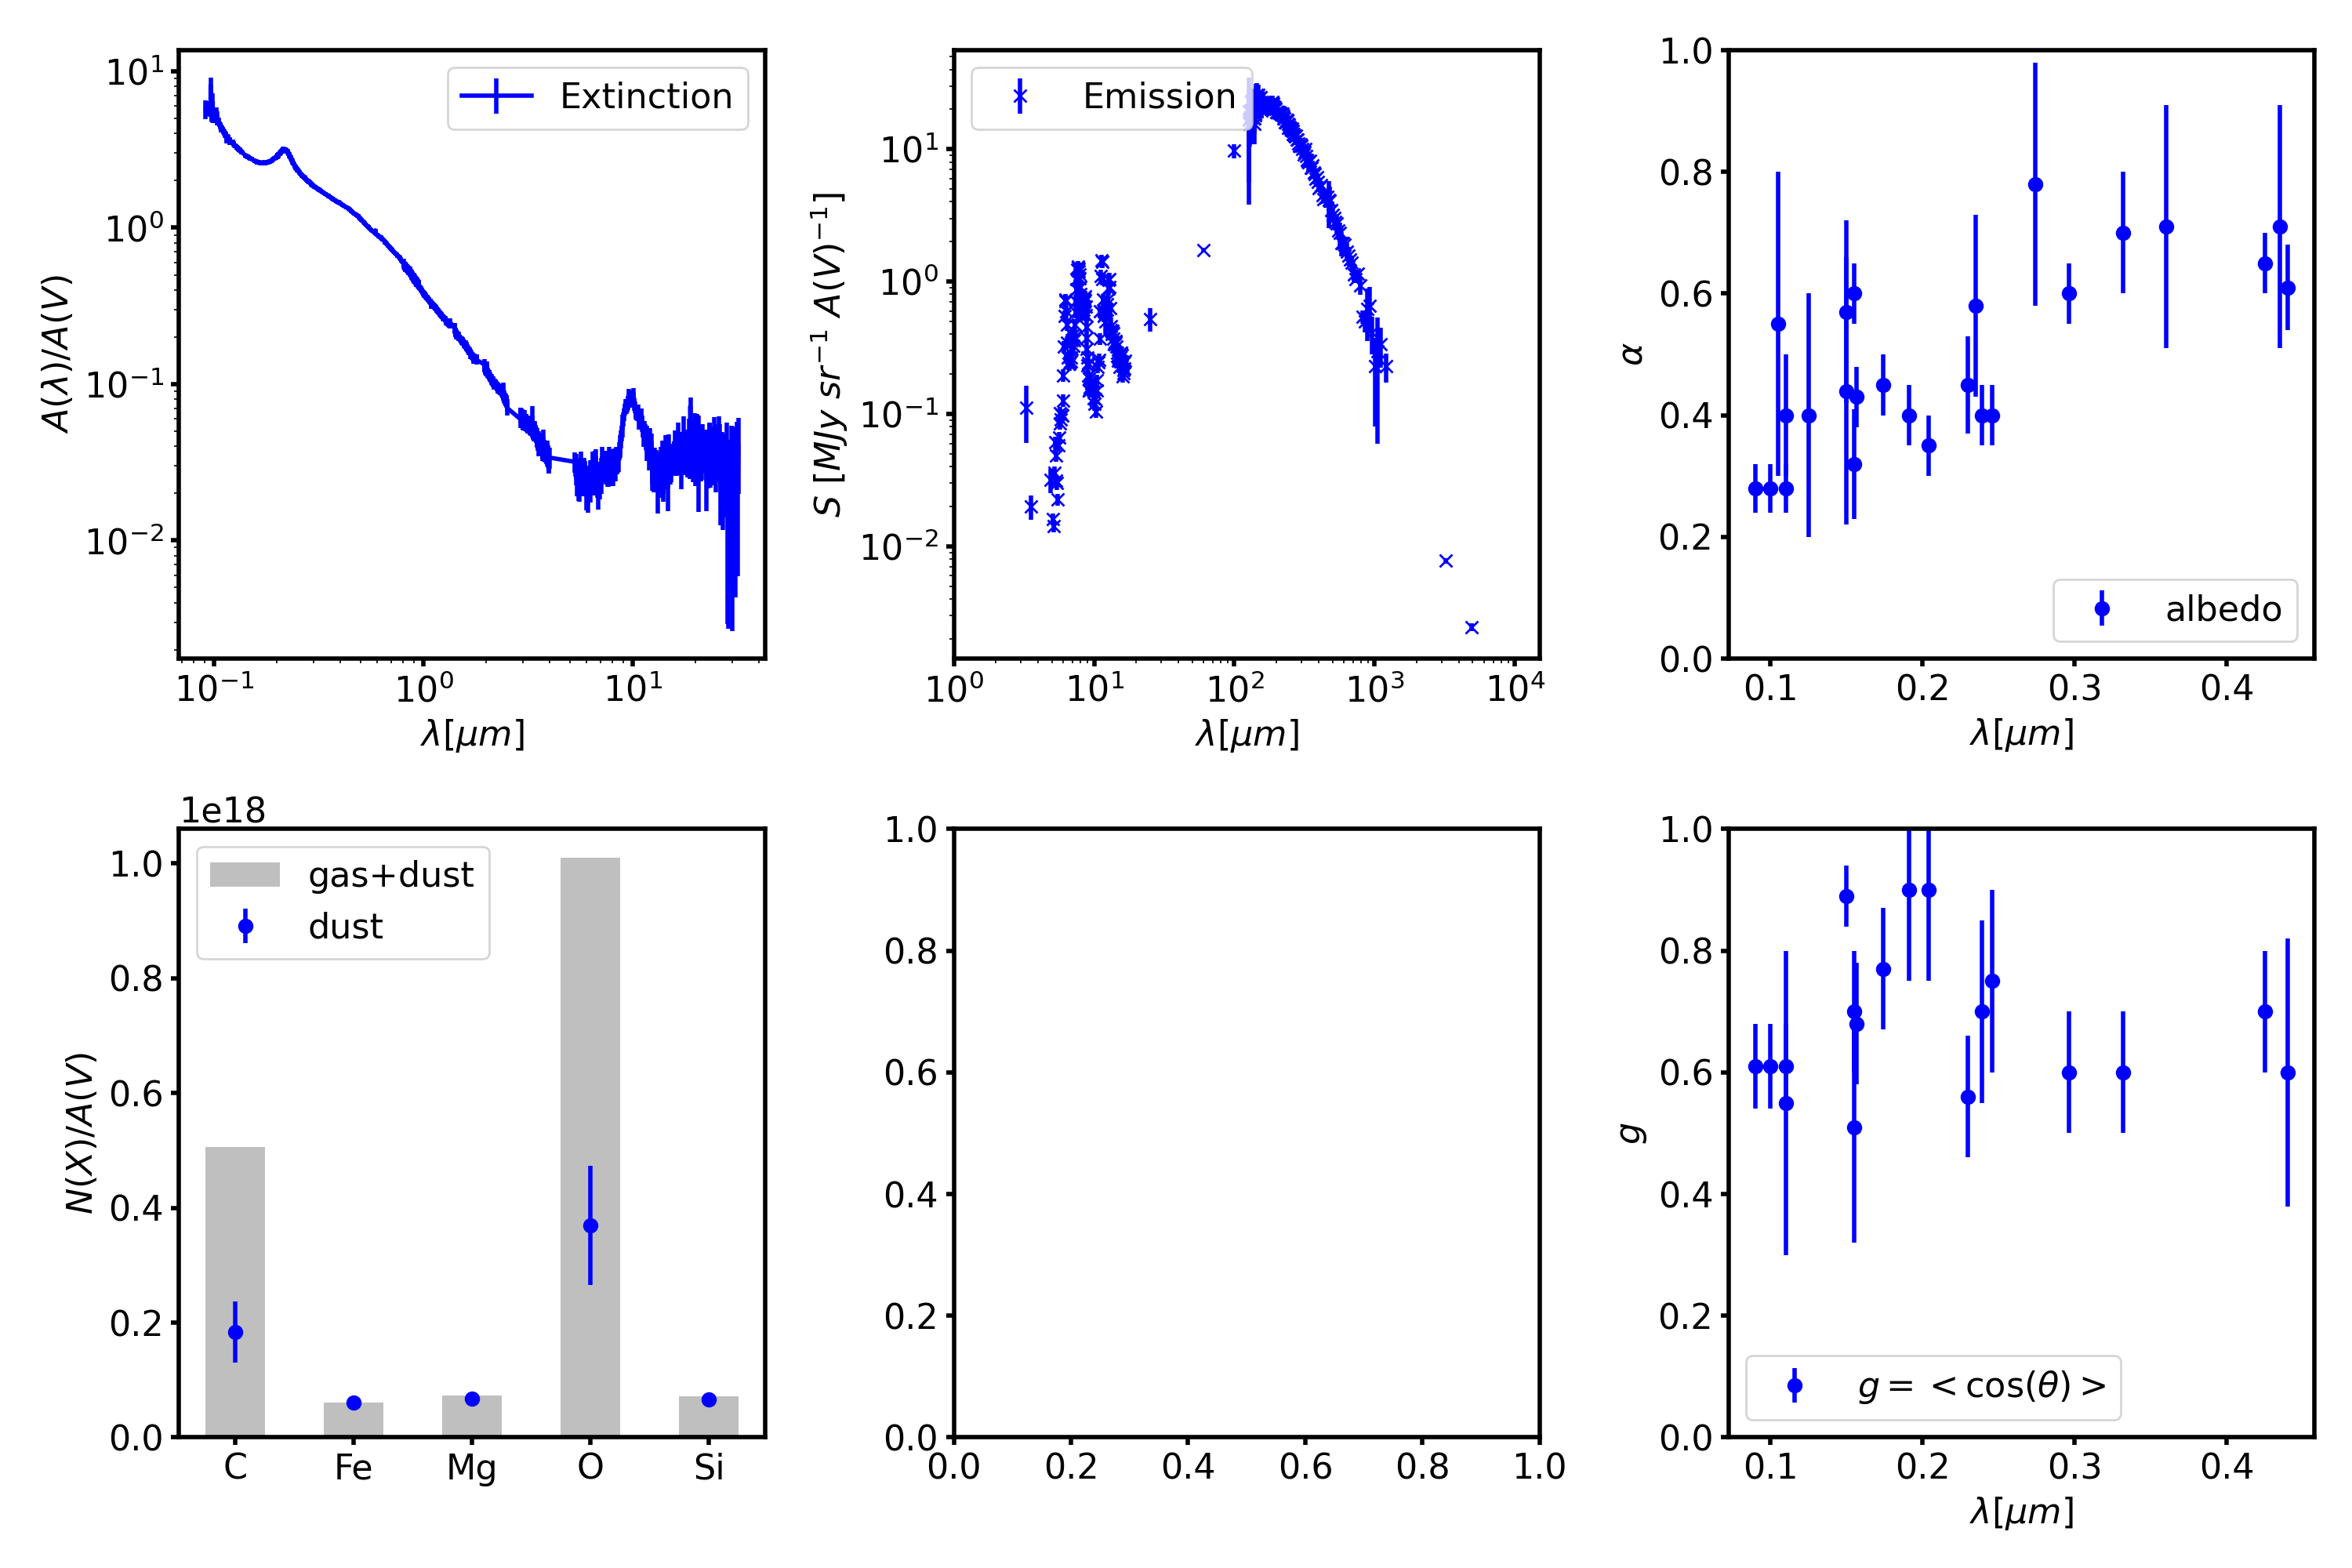
To see an overview of the observed data used, use
dgplot_obsdata obsdata
(Source code, png, hires.png, pdf)

To add the ISRF plot (if available)
dgplot_obsdata obsdata --ISRF ISRFdatafile:
This ISRF plot will pop up in the middle plot of the lower row.